Analysis of tidal data of 6 registration stations
Scope
To analyse the data from 6 tidal registration station.
To simulate the effect on the measurements assuming a rise of the sea level of 1 m over 100 years occurs.
91 years of tidal registration
6 tidal registration stations:
Aberdeen, Dover, Immingham, Milford Haven, North Shields, Sheerness.
5 433 000 data points
One finds a map with the locations of the stations in this notebook (Click to open)
Tidal spectrum
This is one tidal spectrum obtained as the smoothed histogram of measured tidal levels at one station over a time window – a time window can span a few months.
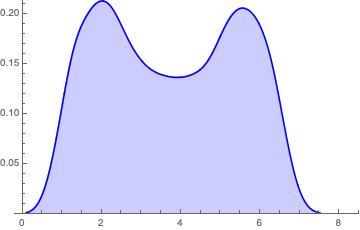
The average spectra for all stations are shown in the next notebook. These are further used as reference spectra.
The superposition of all spectra – for all time windows – for all stations are shown in the next notebook.
The superposition of all spectra per station gives an idea of the range in which the currently observed spectra lay. This is important to remember when we will simultate an assumed sea level rise.
The parameter w is related to the width of the time window. The larger the value, the larger the window, the fewer spectra.
Peak-to-peak
For all spectra we compute the peak-to-peak values to a reference spectrum, in this case the average spectrum.
a: low tide
b: high tide
The concept ia illustrated in the next notebook.
We expect that we can learn something about the evolution looking at the trends of a and b
These are all the results: Open the Notebook
Extrema
We also charted the extreme values for the high tide and low tide for all time windows and all stations.
The results are shown in this notebook
Simulations
We simulated the effect of an assumed sea level rise of 1m over 100 years.
We super-imposed a linearised rise on the observed tidal levels.
This is what we would observe in the spectra
Comparing
In this notebook one finds simulated spectra for all stations
Click here to open the notebook
And in this notebook two sets of spectra for one station are compared:
Left: observed
Right: simulated
Dynamic view for 2 stations
In the Cloud, the animation is not activated.
The video below shows the dynamic behaviour of the tidal spectra for 2 stations under the assumption of a rise of the sea level of 1 m over 100 years.
Spectral shift
In the next notebook one discovers the expected spectral shift for two stations at different times in the future:
In 10, 20 and 30 years.
Looking at the peak-to-peak values
In the next notebook we show the expected effect on the peak-to peak values of the assumed sea level rise:
High and low p-t-p values after 10,20,30,40,50, and 100 years
The station is Dover.
Conclusions
Concerning the sea level rise of 1m over 100 years, we can conclude from the above, that spectral analysis and peak-to-peak analysis of the tidal levels, will provide
No signal in 10 years
A weak signal in 20 years
A strong signal in 30 years.
Data Source
Source: British Oceanic Data Center
Files are open source.
Registrations from 1924 till Feb 2015.
Measurement frequency: hourly till 1992; since 1993 half-hourly.
Copyright
© 2019 JP Tollenboom