DPC-Dynamic Project Control
Paradigm
DPC uses the feedback control paradigm
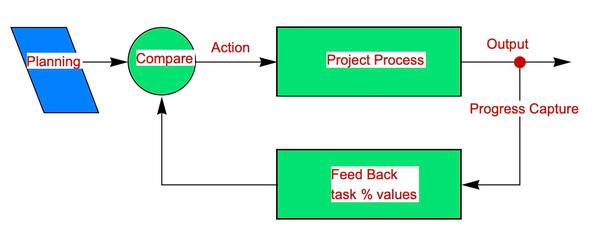
Project Tree
A project must have a sound tree structure.
Integration of Smartsheet ® and Wolfram Cloud.
Smartsheet is a well-known well-established cloud deployed system for collaborative work. It is based on spreadsheet-like sheets.
Such sheets can be Gantt charts for common project planning.
Over the years, about 15 now, we developed a comprehensive system in Mathematica, that automatically generates progress reports from Gantt charts.
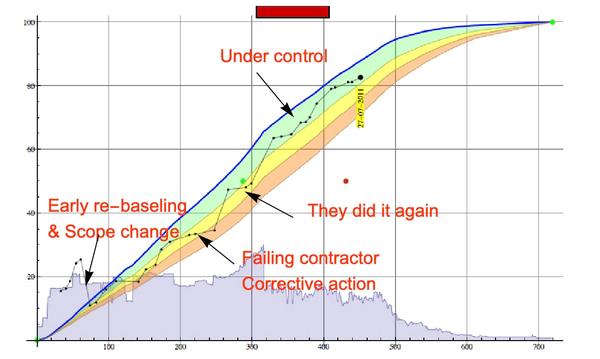
These reports take the form of progress curves, aka S-curves.
This is an S-curve
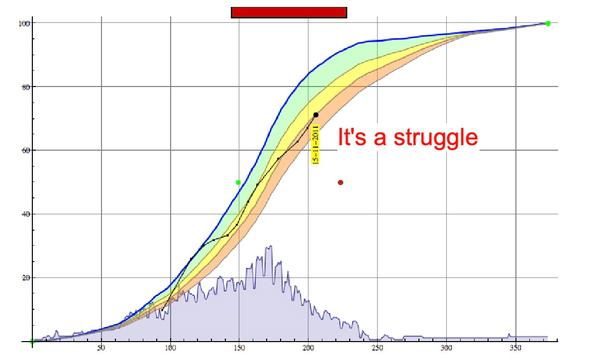
This is another S-curve
The DPC system is now fully deployed in the Wolfram Cloud and integrated with Smartsheet. The system interacts directly with Smartsheet using the API.
Once the planner or the project manager has updated the % Complete values in the Gantt chart, a simple click on a hyperlink will trigger the generation of the latest progress report.
It is important to note that every node in the project tree – commonly called summaries in the Gantt chart – will have its own S-curve.
This means that is becomes very easy to drill down in the project tree to find the parts that are developing problems.
DPC can be used on single projects as well as on portfolios containing tens of separate projects.
Currently portfolios containing 50 projects are being monitored.
The largest projects monitored so far contained 12000 tasks.
Reports are commonly generated on a weekly, bi-weekly basis.
In case of “Turn Around” or “Shut-down” daily reporting are common practice.
Training
We developed a comprehensive set of tutorials to help users get familiar with S-curve analysis, so they can discover their full power of information.
Data Source
Own sources
Copyright
© JP Tollenboom 2019