Financial data viewing
Scope
Sometimes it is interesting to have a view of the position of a given firm, or a small set of firms, compared to their peers.
Solution
Sky view
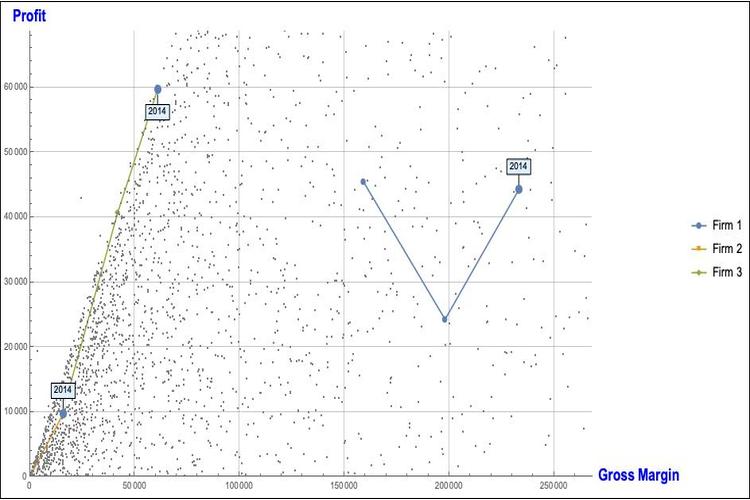
Here we use the so-called “Sky view”.
Two parameters are correlated: Profit and Gross Margin.
The dots in the background are the positions of the peers.
The lines show the evolution over the past 3 years for 3 firms.
Automatic Classification
This is a case where automatic classification has been obtained using machine learning.
The classification has been built for a specific set of firms, all from the same sector.
Two parameters are correlated: profit and total manpower evolution
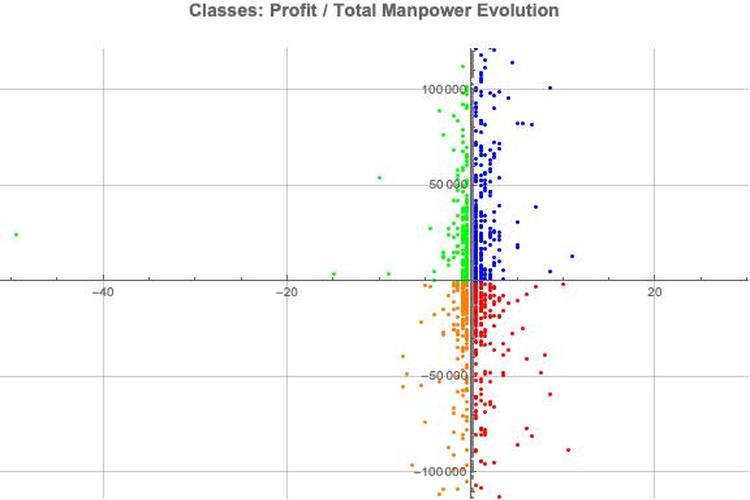
We can define 4 classes: one per quadrant:
Quadrant 1: firms making profit while increasing the manpower
Quadrant 2: firms making profit while decreasing the manpower.
Quadrant 3: firms making losses while decreasing the manpower
Quadrant 4: firms making losses while increasing the manpower.
Data Sources
National Bank of Belgium
Copyright
© 2019 JP Tollenboom, Partner in NARMA 42.