Safety and prevention
Indoor fires during the Holidays
Candles, Christmas trees, and cooking add in an important manner to the cozy feelings during the holidays. However, these ingredients are also particularly accident prone for causing indoor fires.
Demographics of the City of Amsterdam
In the Amsterdam City Data project more than 300 data sets have been made available. Themes include population, environment, public safety, tourism, work, housing and care. These real data tell a story about the city and its residents.
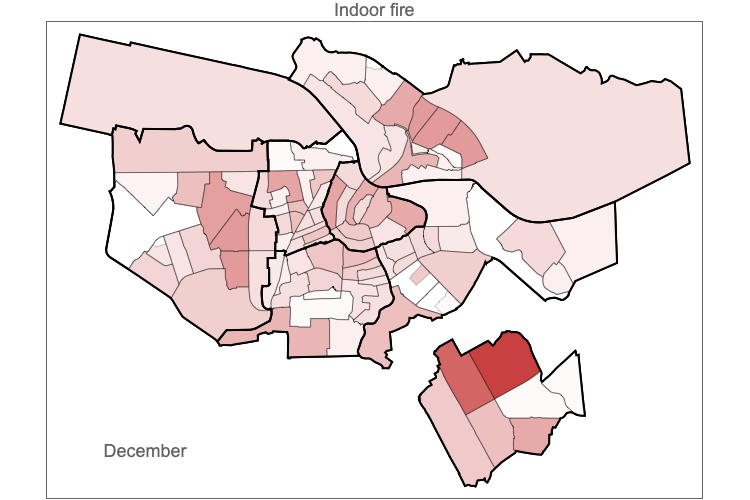
The figure shows the outlines of the districts of the City of Amsterdam. Every neighbourhood is different. The famous 17th century canals are located at the central part of the map. This type of visualization gives us insights into what actually happens in the city.
The coloring represents the number of calls to the Amsterdam Fire Department during the month of December. Especially from the South-East area there are many calls. This is a densely populated area of the city. The Fire Department benefits from this type of knowledge to a better allocation of its resources.
Video
You can watch a video with a full demo here
Visualising Statistics
In the next video you can watch how the statistics of the incidents can be visualised:
- Per incident type
- Per month of the year
- Per day of the week
- Per hour of the day
Data Source
Amsterdam City Data project, The Netherlands.
Copyright
© 2019 Bontekoe Research, Amsterdam. Partner in NARMA42.